Long Island Sound Sentinel Monitoring for Climate Change Program
Northeast Sentinel Monitoring Geospatial Database
Welcome to the Northeast Sentinel Monitoring Geospatial Database tutorial with instructions on how to the sentinel monitoring database to retrieve metadata about monitoring programs. What you will learn in this tutorial:
- database overview
- page orientation
- map controls
- search
- search results
I. Database overview
The purpose of the database is to capture information (metadata) about data sources that could be used to detect changes in the environment due to climate change. The individuals records provide general metadata information about data sources or monitoring programs. The database is a tool that can be used to identify regional or subregional networks to measure environmental change. Another application of the database is to identify data that may be at risk of being lost and establish data rescue priorities.
II. Page Orientation
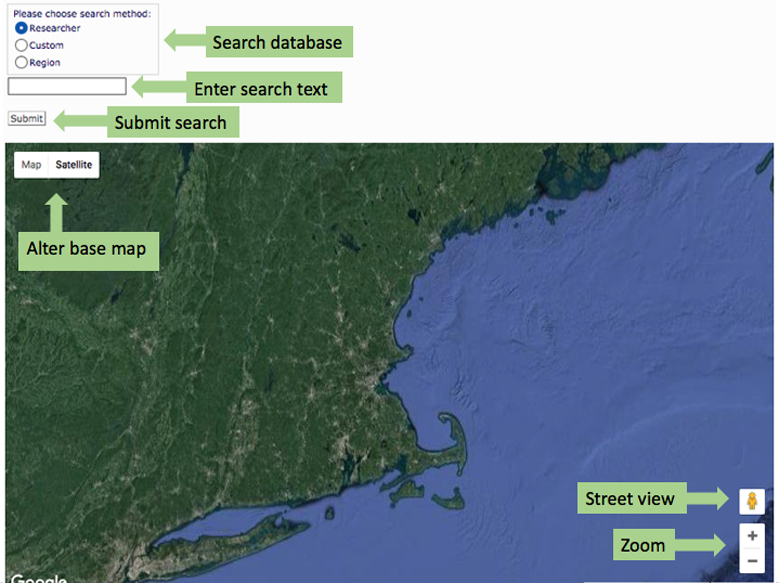
The following is a snapshot of the database page with callout boxes indicating the interactive elements of the page. The interactive elements of this page are:
- Search database - search by Researcher, Custom or Region
- Choose a region from the droplist or select either Researcher or Custom and enter a search term in the text box that appears
- Submit search - click on the submit button to execute the search function (search will search all fields for each record).
- Point locations corresponding to the search are displayed on the map
- Pan & Zoom controls are located in the lower right corner of the map
- to zoom out - double click inside the map box
- to zoom out - depresses control key and double click
- Alter base map - controls are in the upper left corner of the map - selected satellite (aerial photography) or map (similar display to a topographic map)
- List of search results - are returned to the text box on the left side of the page below the map.
- Details of an individual record - are displayed in the text box on the right side of the page below the map.
- Click a point to generate a popup that describes that provides a title for the record; click on the hyperlink and the full record displays below the map in the right column.
- Scroll map - use the scroll pad close the hand and drag the map
- use the arrow buttons on the keyboard to scrol
Note: the location of mouse arrow on the page controls paging functions. If you made the map box active by clicking inside the map - then use of the scroll pad will resize the map (zoom in or out). If the page was selected, then use of the scroll pad will cause the page to scroll up or down.
III. Map Controls
There are two maps controls available - navigation (pan/zoom) and base map type.
A. Navigation
In this section you will learn how to use the navigation controls to pan, zoom and activate street view.
B. Base Map
Select Satellite (rightmost image below) to view aerial photography or Map (leftmost image below) to view a cartographic map similar to a USGS topographic map. In Satellite view, mouse over the Satellite button and a popup box called “Label” will appear. Click the box to display place and feature names.
IV. Search
Accessing database information (records) requires the use of the search tool. There are three components to the search tool. Choose a search method (#1) - select a radio button (Researcher, Custom or Region). Selecting Regions generates a drop down list (#2) or selecting Research or Custon requires the entering of a word (name) or phrase. To complete the search, click the submit button (#3).
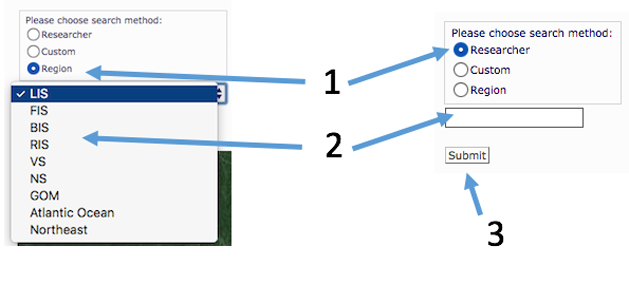
Note: To return all records in the database, choose custom but leave the text box blank and click the submit button.
V. Search Results
The following image shows the results of a search. Locations are displayed on the map as either yellow or red points. Yellow signifies a specific location for the record but red points are a general location that represent multiple stations with a monitoring program. This approach was choosen to reduce map clutter. However, widely spaced stations such as NOAA tide stations each point reflects an individual station. Click on a point and a pop-up is displayed with the Program Name/Description. Click on the link in the pop-up, and the detailed record will display below the map.
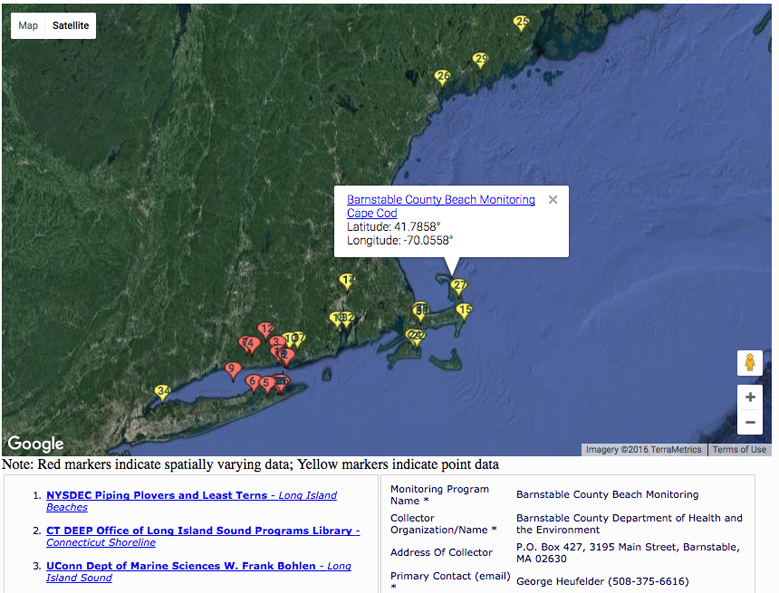
When a search is executed, a list of records is displayed below the map and contain the Program Name/Description in the left column. The numbers correspond with the numbers on the map. Click on a link in the list in the left column, and the reocord will display in the right column.
A record returns the following information:
- Monitoring Program Name
- Collector Organization/Name
- Address of Collector
- Primary Contact (email)
- Secondary Contact (email)
- State or Province
- Waterbody (primary)
- Waterbod (secondary)
- Ecoregion
- Latitude - reported in decimel degrees
- Longitude - reported in decimel degrees
- Monitoring Location Description
- Habitat Type(s)
- Habitat Quality
- Monitoring Objective
- Parameters Measured
- Additional Parameters
- Climate Change Indicator - yes or no
- Site Selection Method
- Data Collection Equipment
- Data Collection Start
- Data Collection End
- Collection Dates
- Collection Frequency
- Data Format
- Digital Data Format
- Spatial Data - yes (as in the case a single point that represents multiple stations) or no (record is represented by a single point/location
- Website
- Metadata File - yes or no; does such documentation exist
- QA/QC - yes or no (quality control documentation)
- Data Distribution Policy
- Citations
- Documents
- Comments
- Sentinel - these are “indicators” and “core parameters” identified in the Strategic Plan.
- Historic Data
- Managed Areas
- Partnerships
- Regional Observation Networking
- Synthesis
- Long-term Monitoring
|